Welcome to Rateme’s Documentation
Summary
Goal
RateMe is a trial project developed for evaluating the image attractiveness. Using this service, people could upload their images and get a private objective score. In that way, users could obtain the most likely rating before post their photos on social media.
Methods we used
RateMe’ design allows to perform a scientific look evaluation. The score is calculated based on more than 7500 images from scraped from reddit. We used tpot and tensor flow to implement machine learning algorithms and analise the relation between image’ features and score obtained. Then, with this information we predict the score for new inputs.
Analysis and results
First results reveal the complexity of performing a good evaluation, given the highly different kind of images uploaded by the users. The analysis also exposed the relation between photo’s comments and score given the gender.
Future work
RateMe could be used to predict image score, but also to find insights about social patterns related with the gender and age. Future work could include also extend the application to suggest users how to improve their photos to have higher ratings or help users to choose best image for CV or profile picture.
Setup
Rateme can be installed from scratch using the following commands:
git clone https://github.com/rateme-hyids17/Rateme.git
cd Rateme
pip install -r requirements.txt
We have tested our program in:
- Linux Ubuntu 16.x, 17.x, MacOS Sierra
- Python 3.5.x 64 bits (tensorflow requires 64bits)
We anticipate that the program also works in other OS(s), but there might be some problems due to 3rd party python package installations. For example, in Windows some of the modules require installation by wheel (pip fails).
Reddit API
In order to scrap data from reddit, you must have an access to Reddit API. Once you have it, you have to fill the required fields in reddit_api.cfg inside the Rateme folder.
This tutorial presents the procedure to get the Reddit API access Reddit API.
Running options
User can check all the available options using:
python rateme.py -h
This will show all the available arguments and values for usage:
usage: rateme.py [-h] [-q QUERY_LEVEL] [-a APPLICATION_MODE] [-i IMAGE] [-t]

optional arguments:
 -h, --help
           show this help message and exit

 -q QUERY_LEVEL, --query_level QUERY_LEVEL
           The query level for scraping submissions from reddit/r/Rateme. (DEFAULT: -q 1year)
           Available values: 1day, 1week, 1month, 3months, 6months, 1year, 3years.

 -a APPLICATION_MODE, --application_mode APPLICATION_MODE
           Choose application mode to perform. (DEFAULT: -a scrap)
           Available values: scrap, tpot, nn.

 -i IMAGE, --image IMAGE
           Image path to be predicted.

 -t, --train_scratch
           Train tpot from scratch.
Examples:
The following will scrap 3 years of data from reddit.com/r/Rateme subreddit:
python rateme.py -a scrap -q 3years
Second example will train tpot pipeline from scratch and it will predict on given image:
python rateme.py -a tpot -t -i image/test.jpg
Third example will predict the given image using already fitted pipeline in tpot:
python rateme.py -a tpot -i image/test.jpg
Last example will predict the given image using Neural Network:
python rateme.py -a nn -i image/test.jpg
Results
Our goal was to fit a machine learning model to a data set of pictures with ratings as labels, in order to predict the attractivness of new pictures. Only male images were used in the training, because attractivness criteria might differ between the sexes and almost all images were male.
First we tried to retrain the last layer of a neural network called Inception-v3 (https://www.tensorflow.org/tutorials/image_recognition), that is trained to recognize a 1000 different object classes in images. We used a retrainer provided by TensorFlow for the task (https://www.tensorflow.org/tutorials/image_retraining). The images were divided into classes from 3 to 9 based on the rounded rating. Classes 1, 2 and 10 were omitted due to lack of samples. The resulting neural network got a 20% test accuracy, which wasn’t great, but still better than a completely random guess of 14%.
We also tried if tpot could find a good regressor for the task. For this we extracted the faces from the images using a Haar Cascades (https://docs.opencv.org/master/d7/d8b/tutorial_py_face_detection.html) and transformed the faces into 64x64 grayscale images. For this data tpot achieved average distance from the true score of 1.31 in the test set. We also used the rounded prediction and compared it to the rounded true label to get a similar accuracy measure to the neural network, reaching 27%, which is way better than the network’s 20%. This might be due to overfitting though, because most of the images were concentrated in just a couple of classes (6, 7 and 8). The tpot’s chosen model was RidgeCV.
In addition we experimented with dimensionality reduction on the data before learning with tpot, because a 64x64 grayscale image has 4096 features, and all of the are probably not that important. The reduction methods used were PCA (with 50, 1000 and 2048 components) and linear discriminant analysis, but both produced worse results than the raw data with all 4096 features.
Lastly we tried applying Gabor filters on the images. Gabor filters have been used in texture analysis, so we thought they might help in extracting useful features. This didn’t improve results.
Our next idea was to extract features, such as does the image have a smile, using Haar Cascades. Then we could do analysis of what kind of features attractive images tend to have. This failed however, because the Haar Cascades did a horrible job. Only the face detection really works and even then you have to select the largest face found, because the classifier finds faces in all kinds of weird places.
Analysis
- We have collected information from users for different periods of time:
- 1 day
- 1 week
- 1 month
- 3 months
- 6 months
- 1 year
- 3 years
We started analysing the original data distributions to identify common patterns, outliers and the minimum number of samples necessary to perform the prediction.
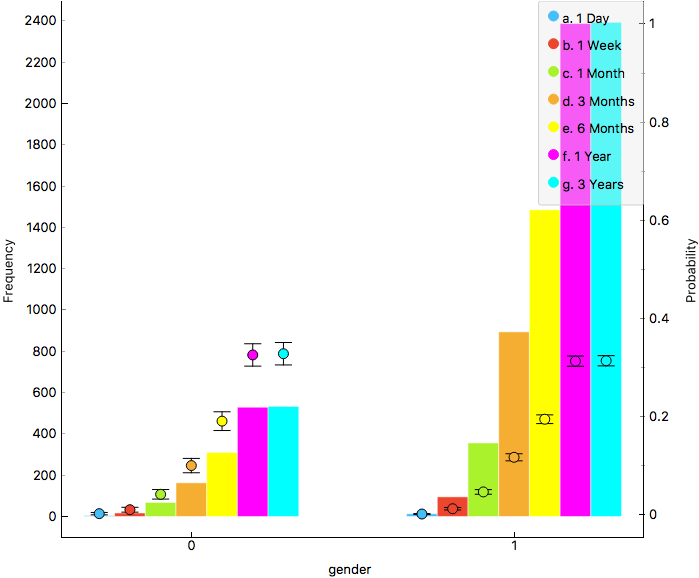
Figure 1. Gender histogram.
Figure 1 shows the gender histogram, it revels the difference in female and male samples. The number of samples is similar for low periods (1 day, 1 week), then it starts raising for male samples. From 1 year samples, the difference in frequency is stable.
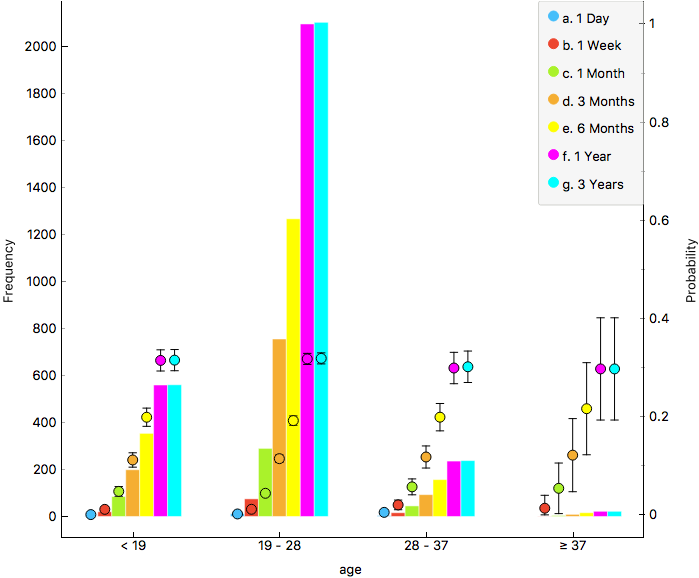
Figure 2. Age histogram.
In terms of age, samples are mostly distributed between 19 and 28 years old. The second interest group is the one for people under 19 years old. On the other hand, people over 28 years old represents less than the 50% of the second interest group. We also see the same behavior as in Gender histogram regarding sampling period.
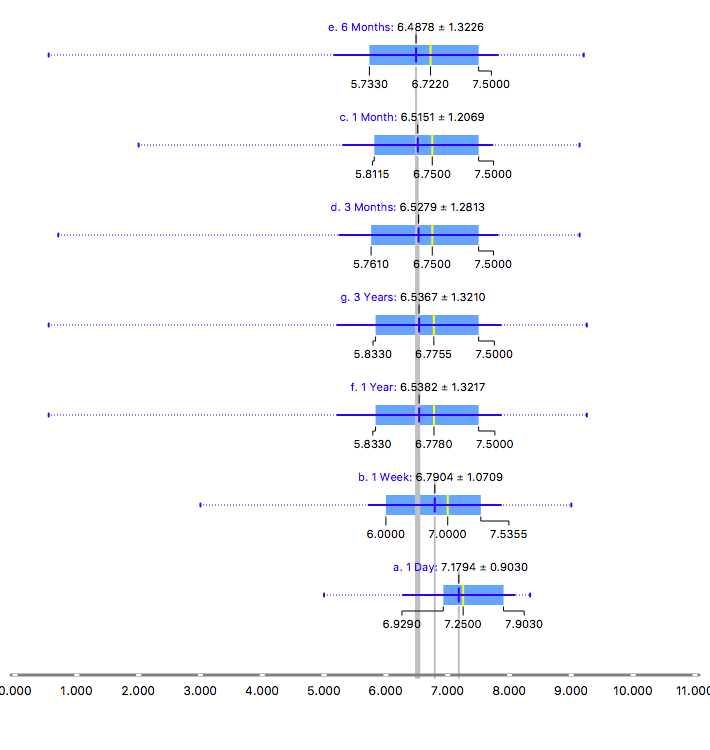
Figure 3a. Box-plot, score distributions by period of time
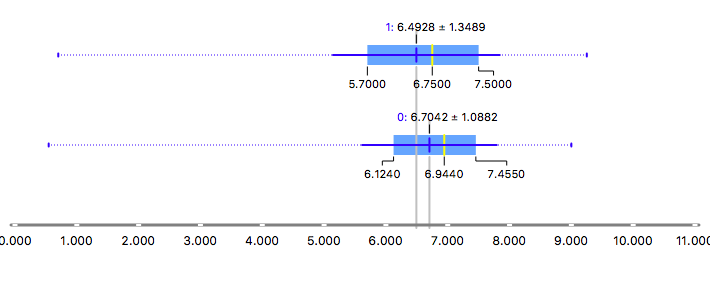
Figure 3b. Box-plot, score distributions by gender:
Figures 3a and 3b show the distribution of the score grouped by periods of time and gender. In general, the score is distributed between 5.5 and 8 points. Means and medians are similar for samples greater than 3 months, below this number data is sparse and misclassification could be more possible. On the other hand, male scores tend to be more diverse than female ones, which would make difficult for prediction tasks, given that differences between pictures could be tiny.
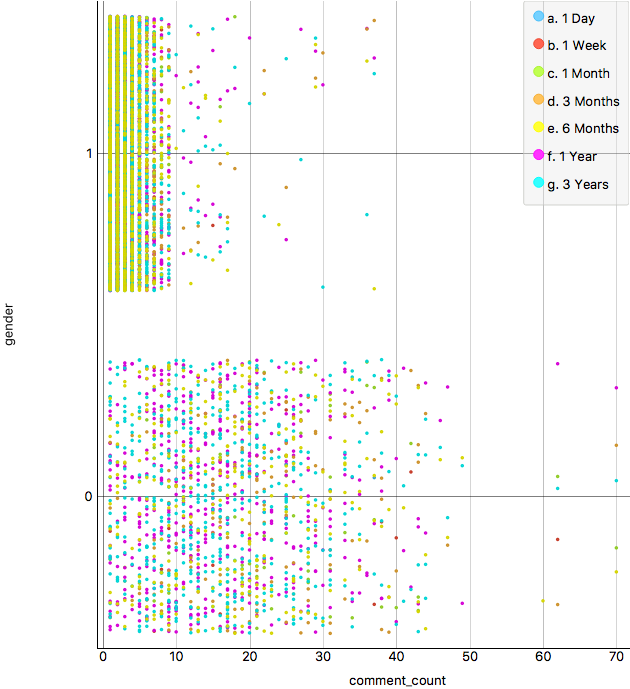
Figure 4a. Comments distribution:
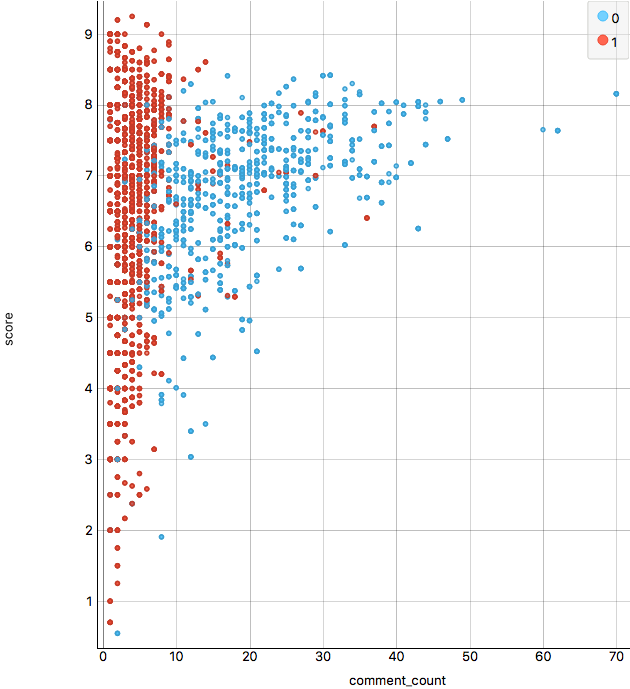
Figure 4b. Comments distribution.
Figure 4 shows the patterns found concerning with comments. The number of comments does not seem to be affected by period of time, which is logic given that it should depends on factors closer to picture composition. It is outstanding the relation between comments-gender compared with score distributions due to score for males is more spread, however comments are highly clustered in less than 10 comments, while female picture comments are very diverse and get the highest numbers. This statement is clearer in Figure 4b, where we also confirm the relation comments-score (high score pictures tends to have more comments, and this is stronger for female pictures.)